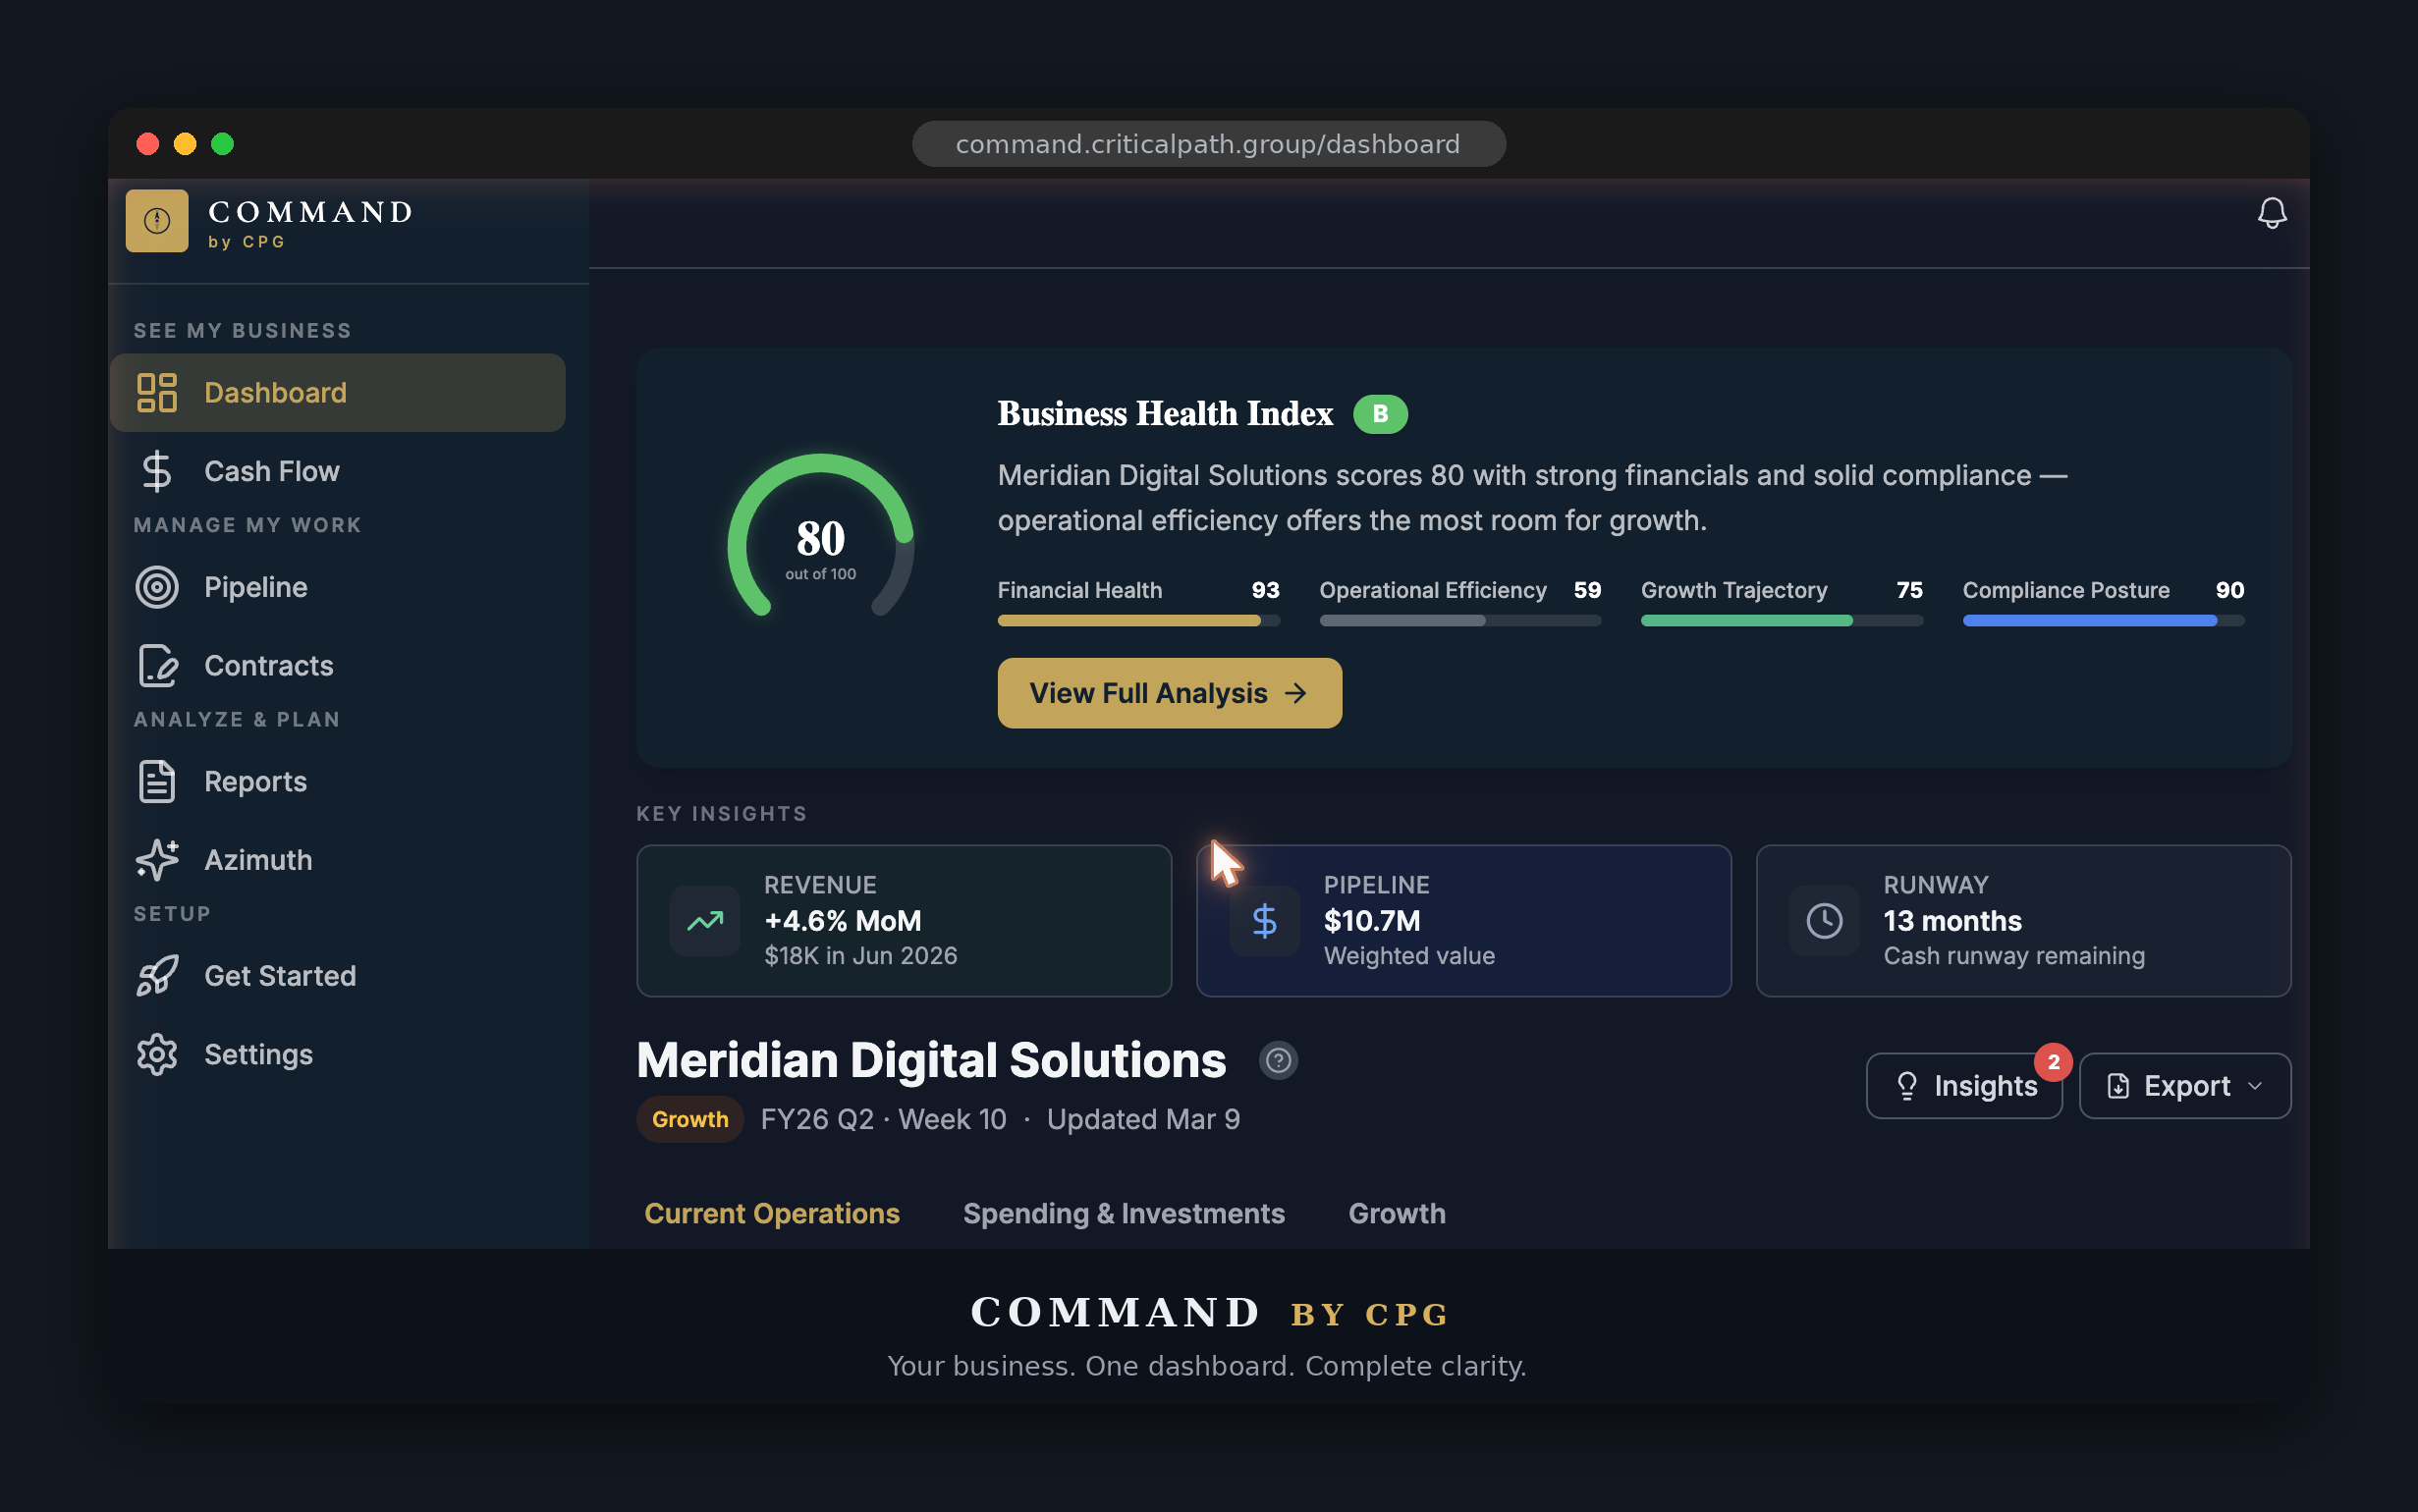
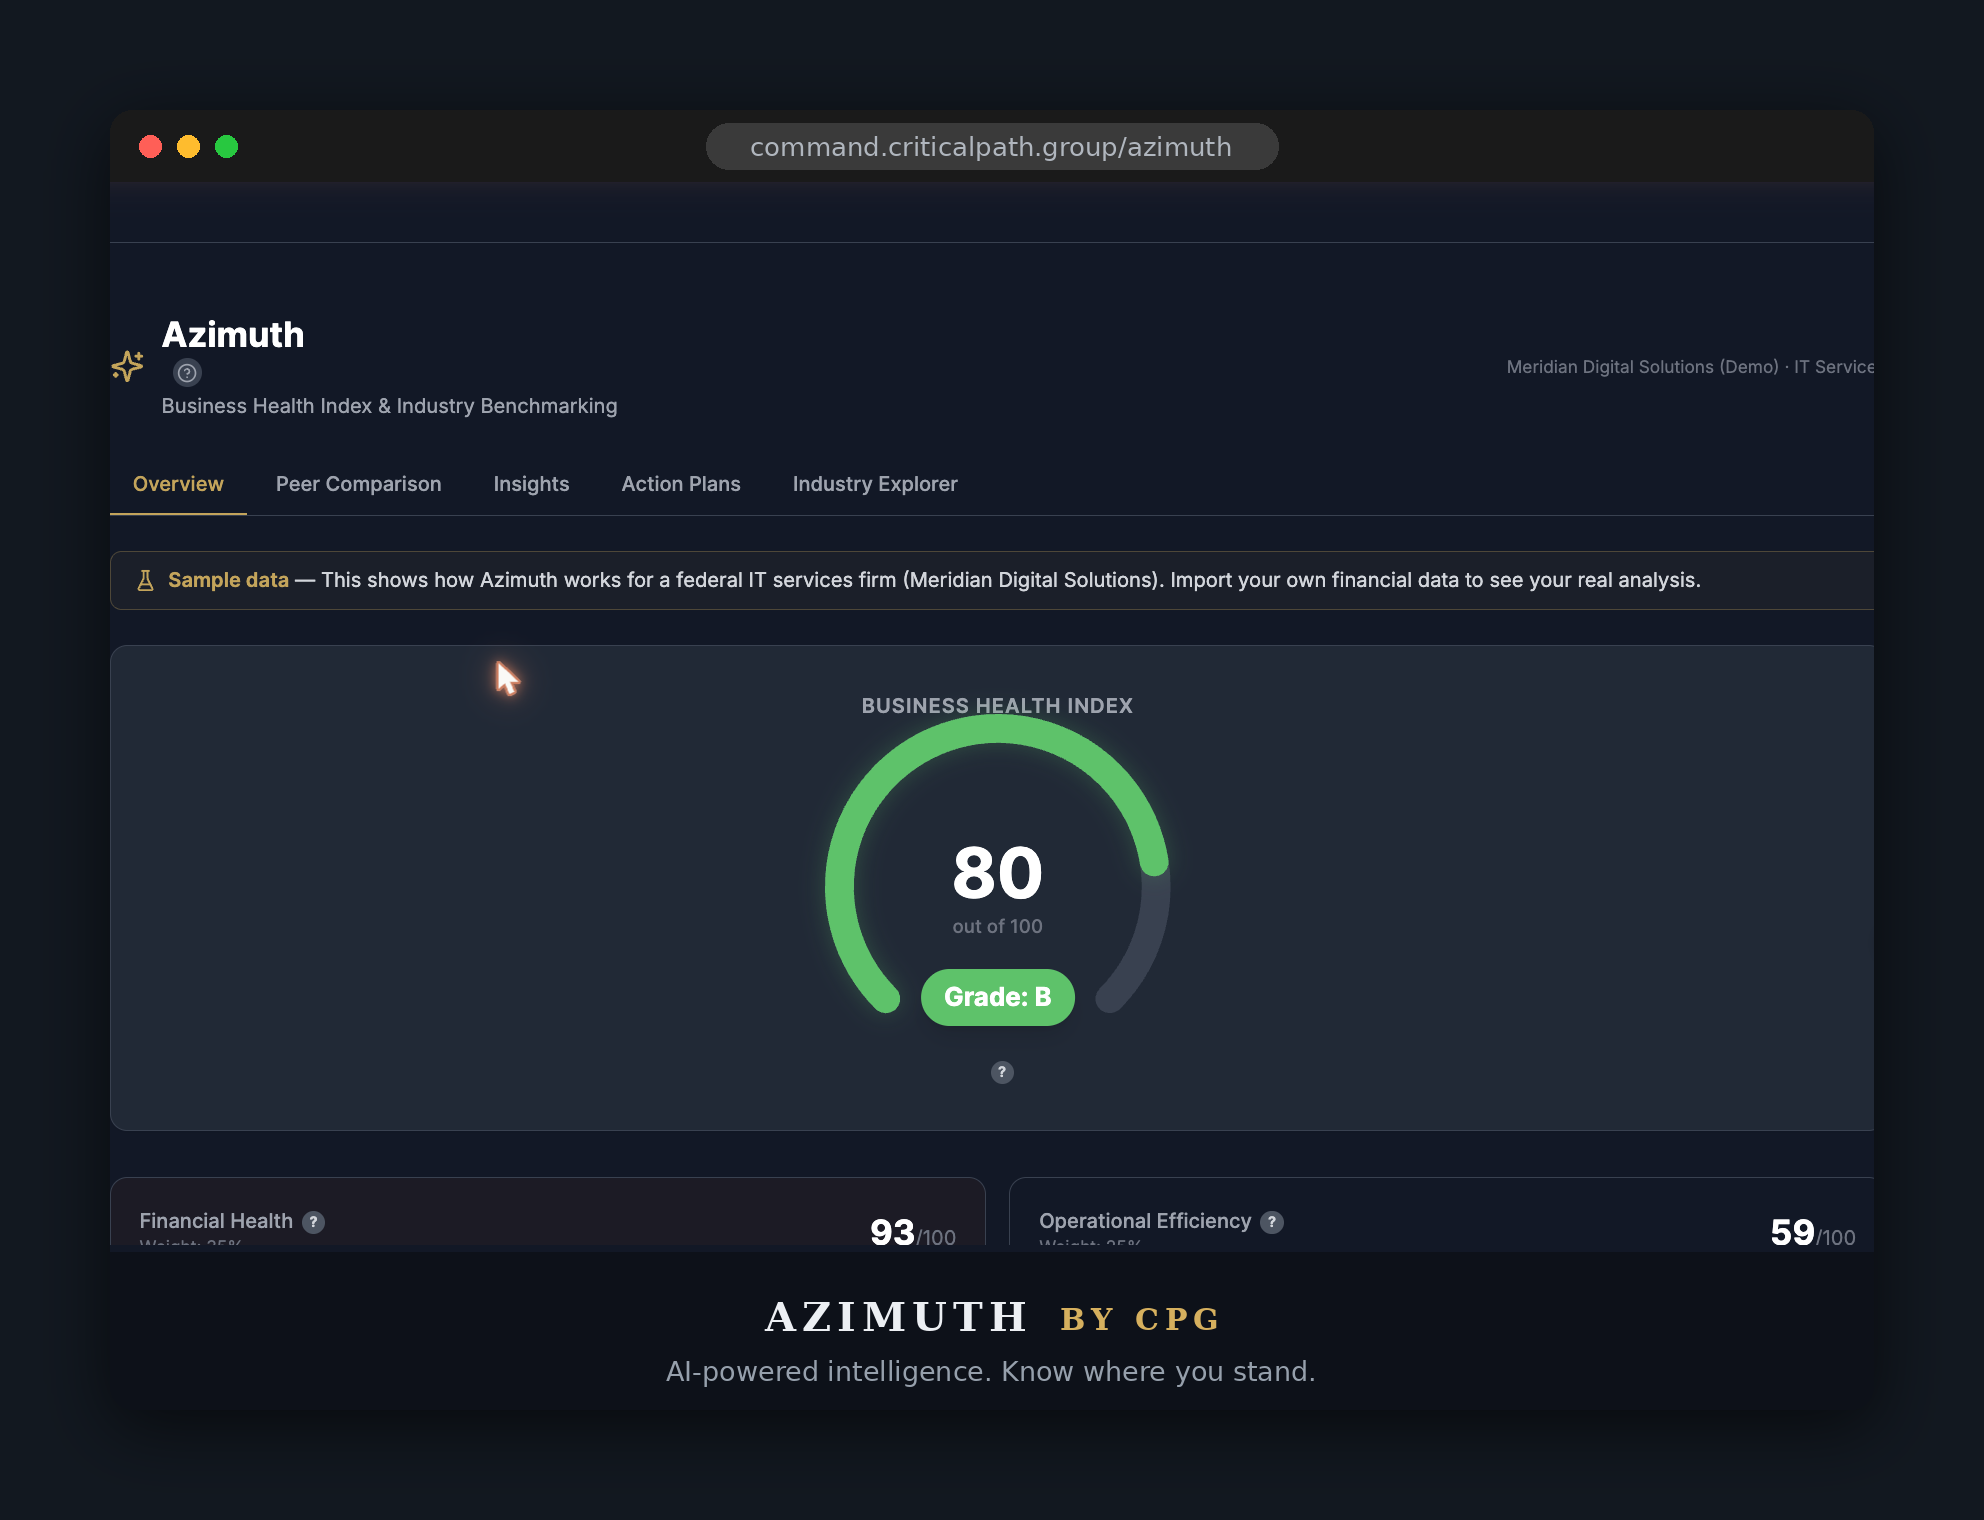
Command is the financial dashboard that tells you how you stack up against peers your size.

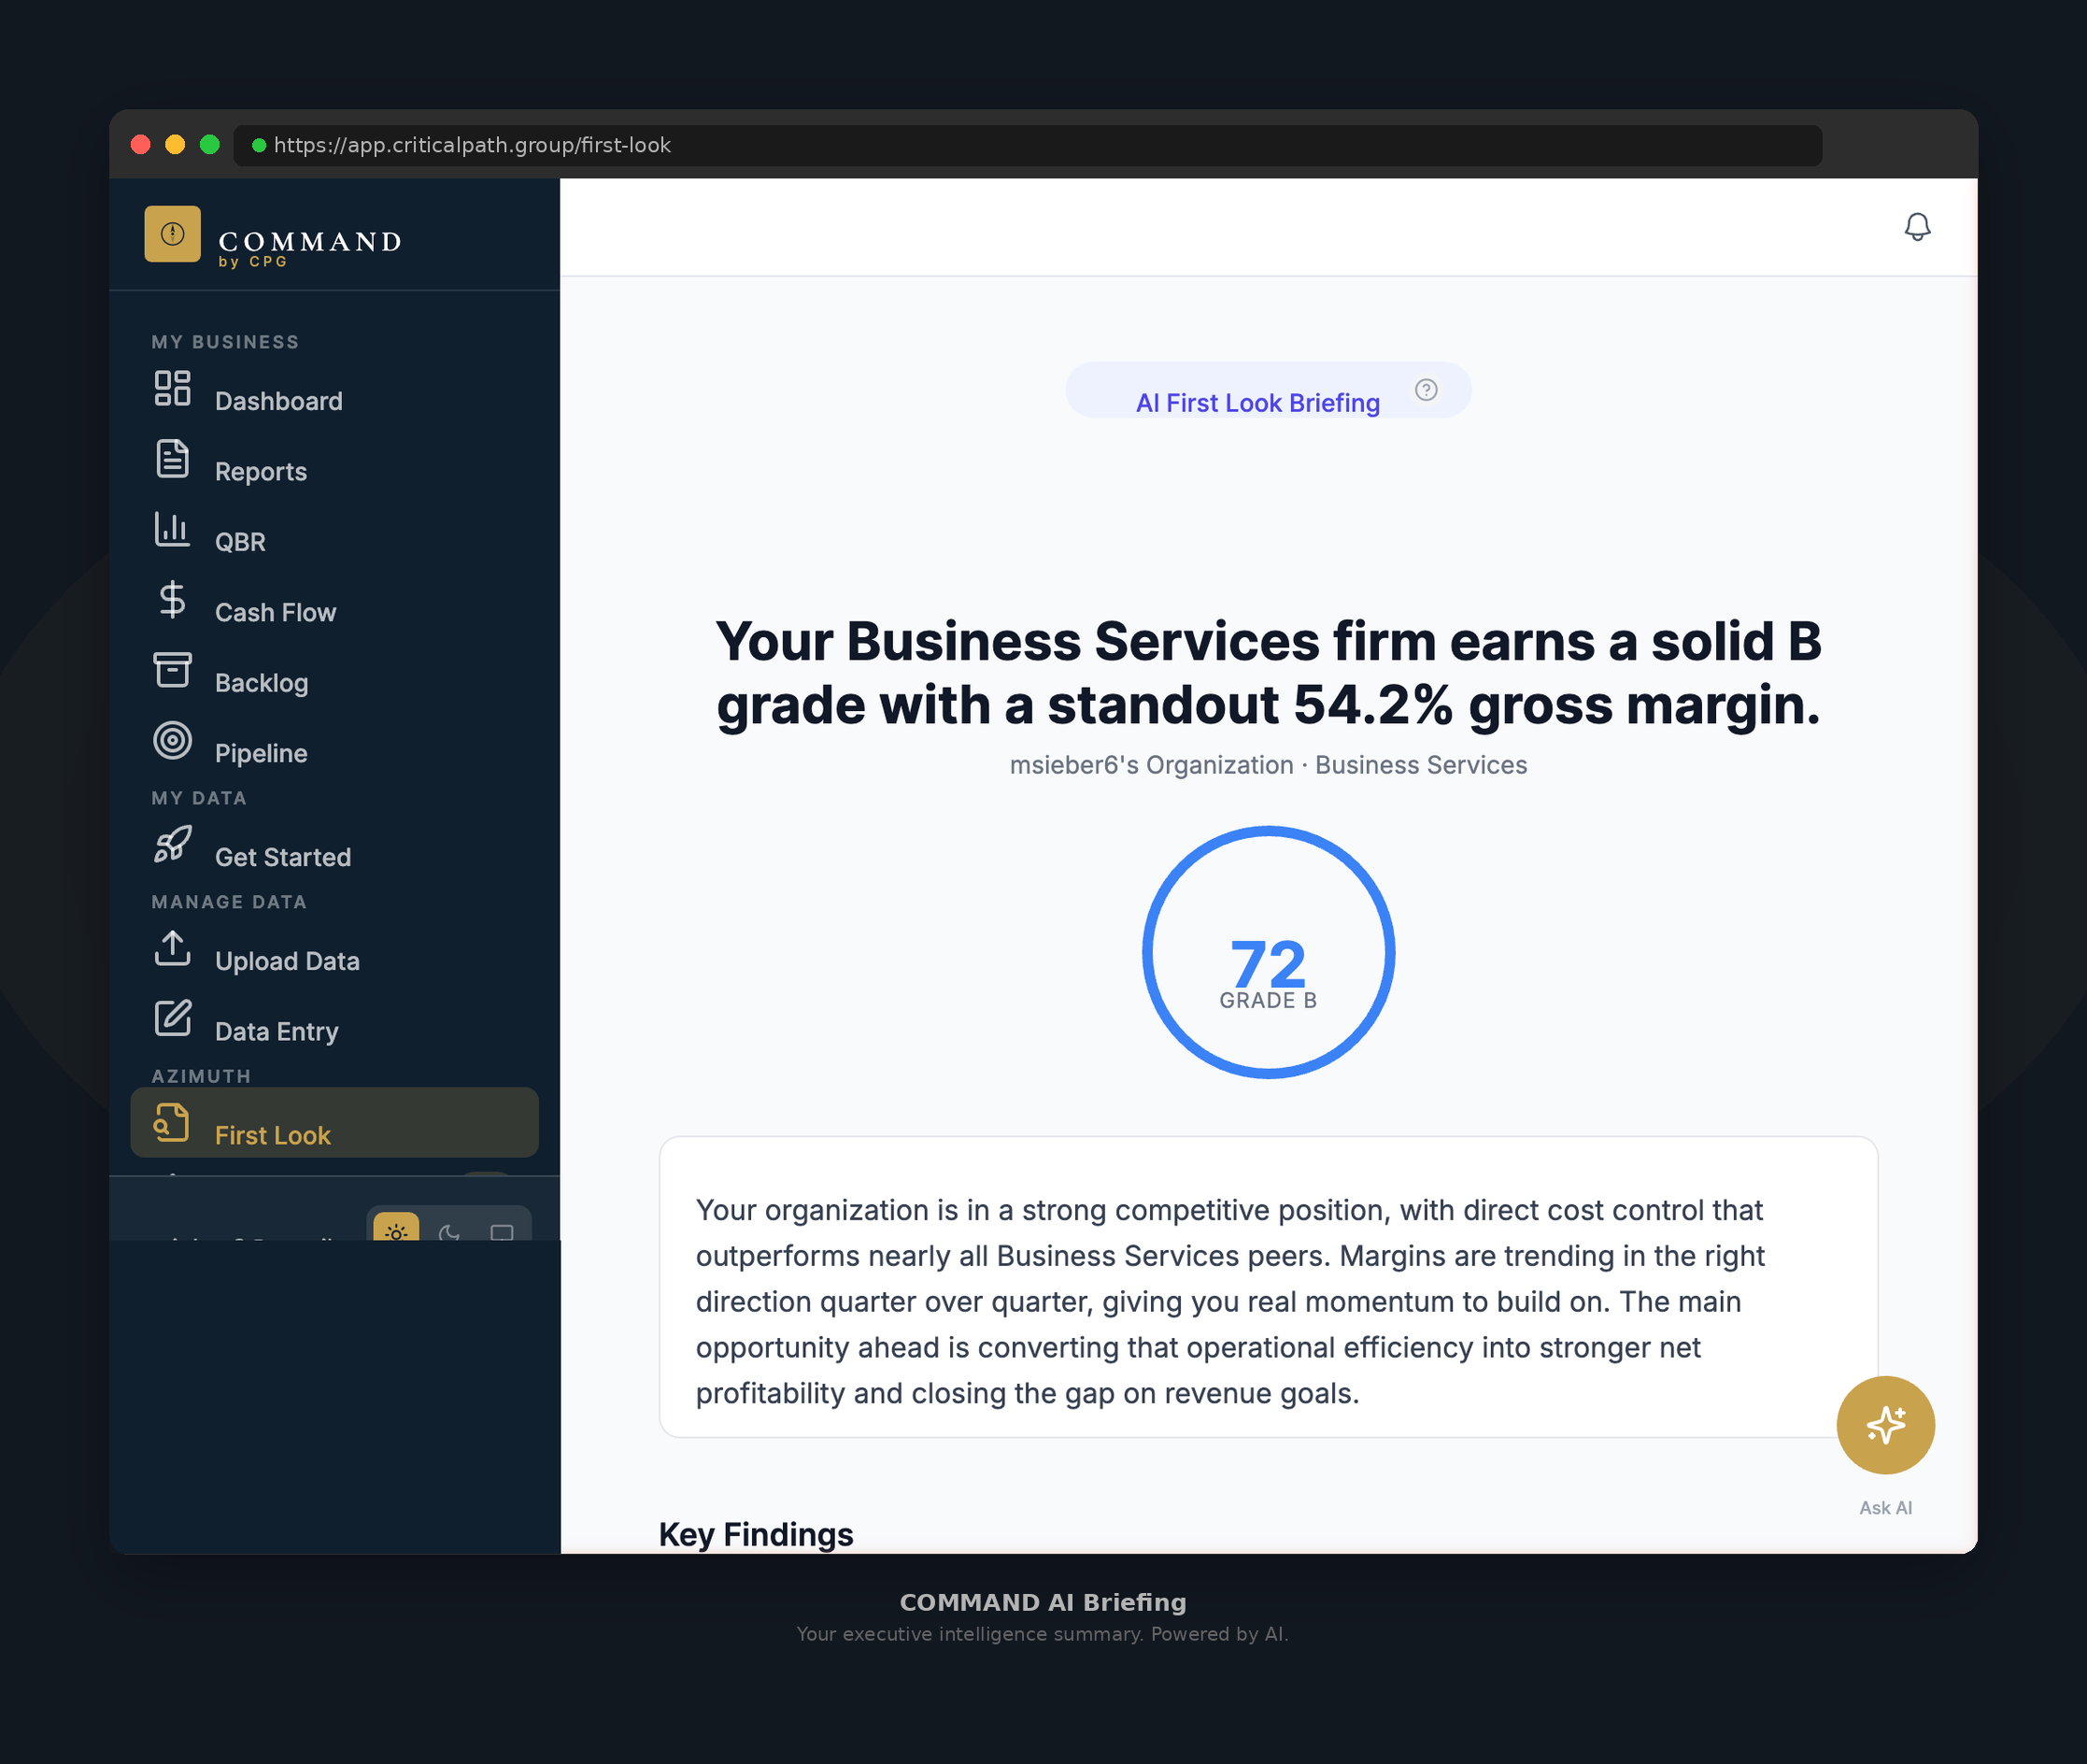
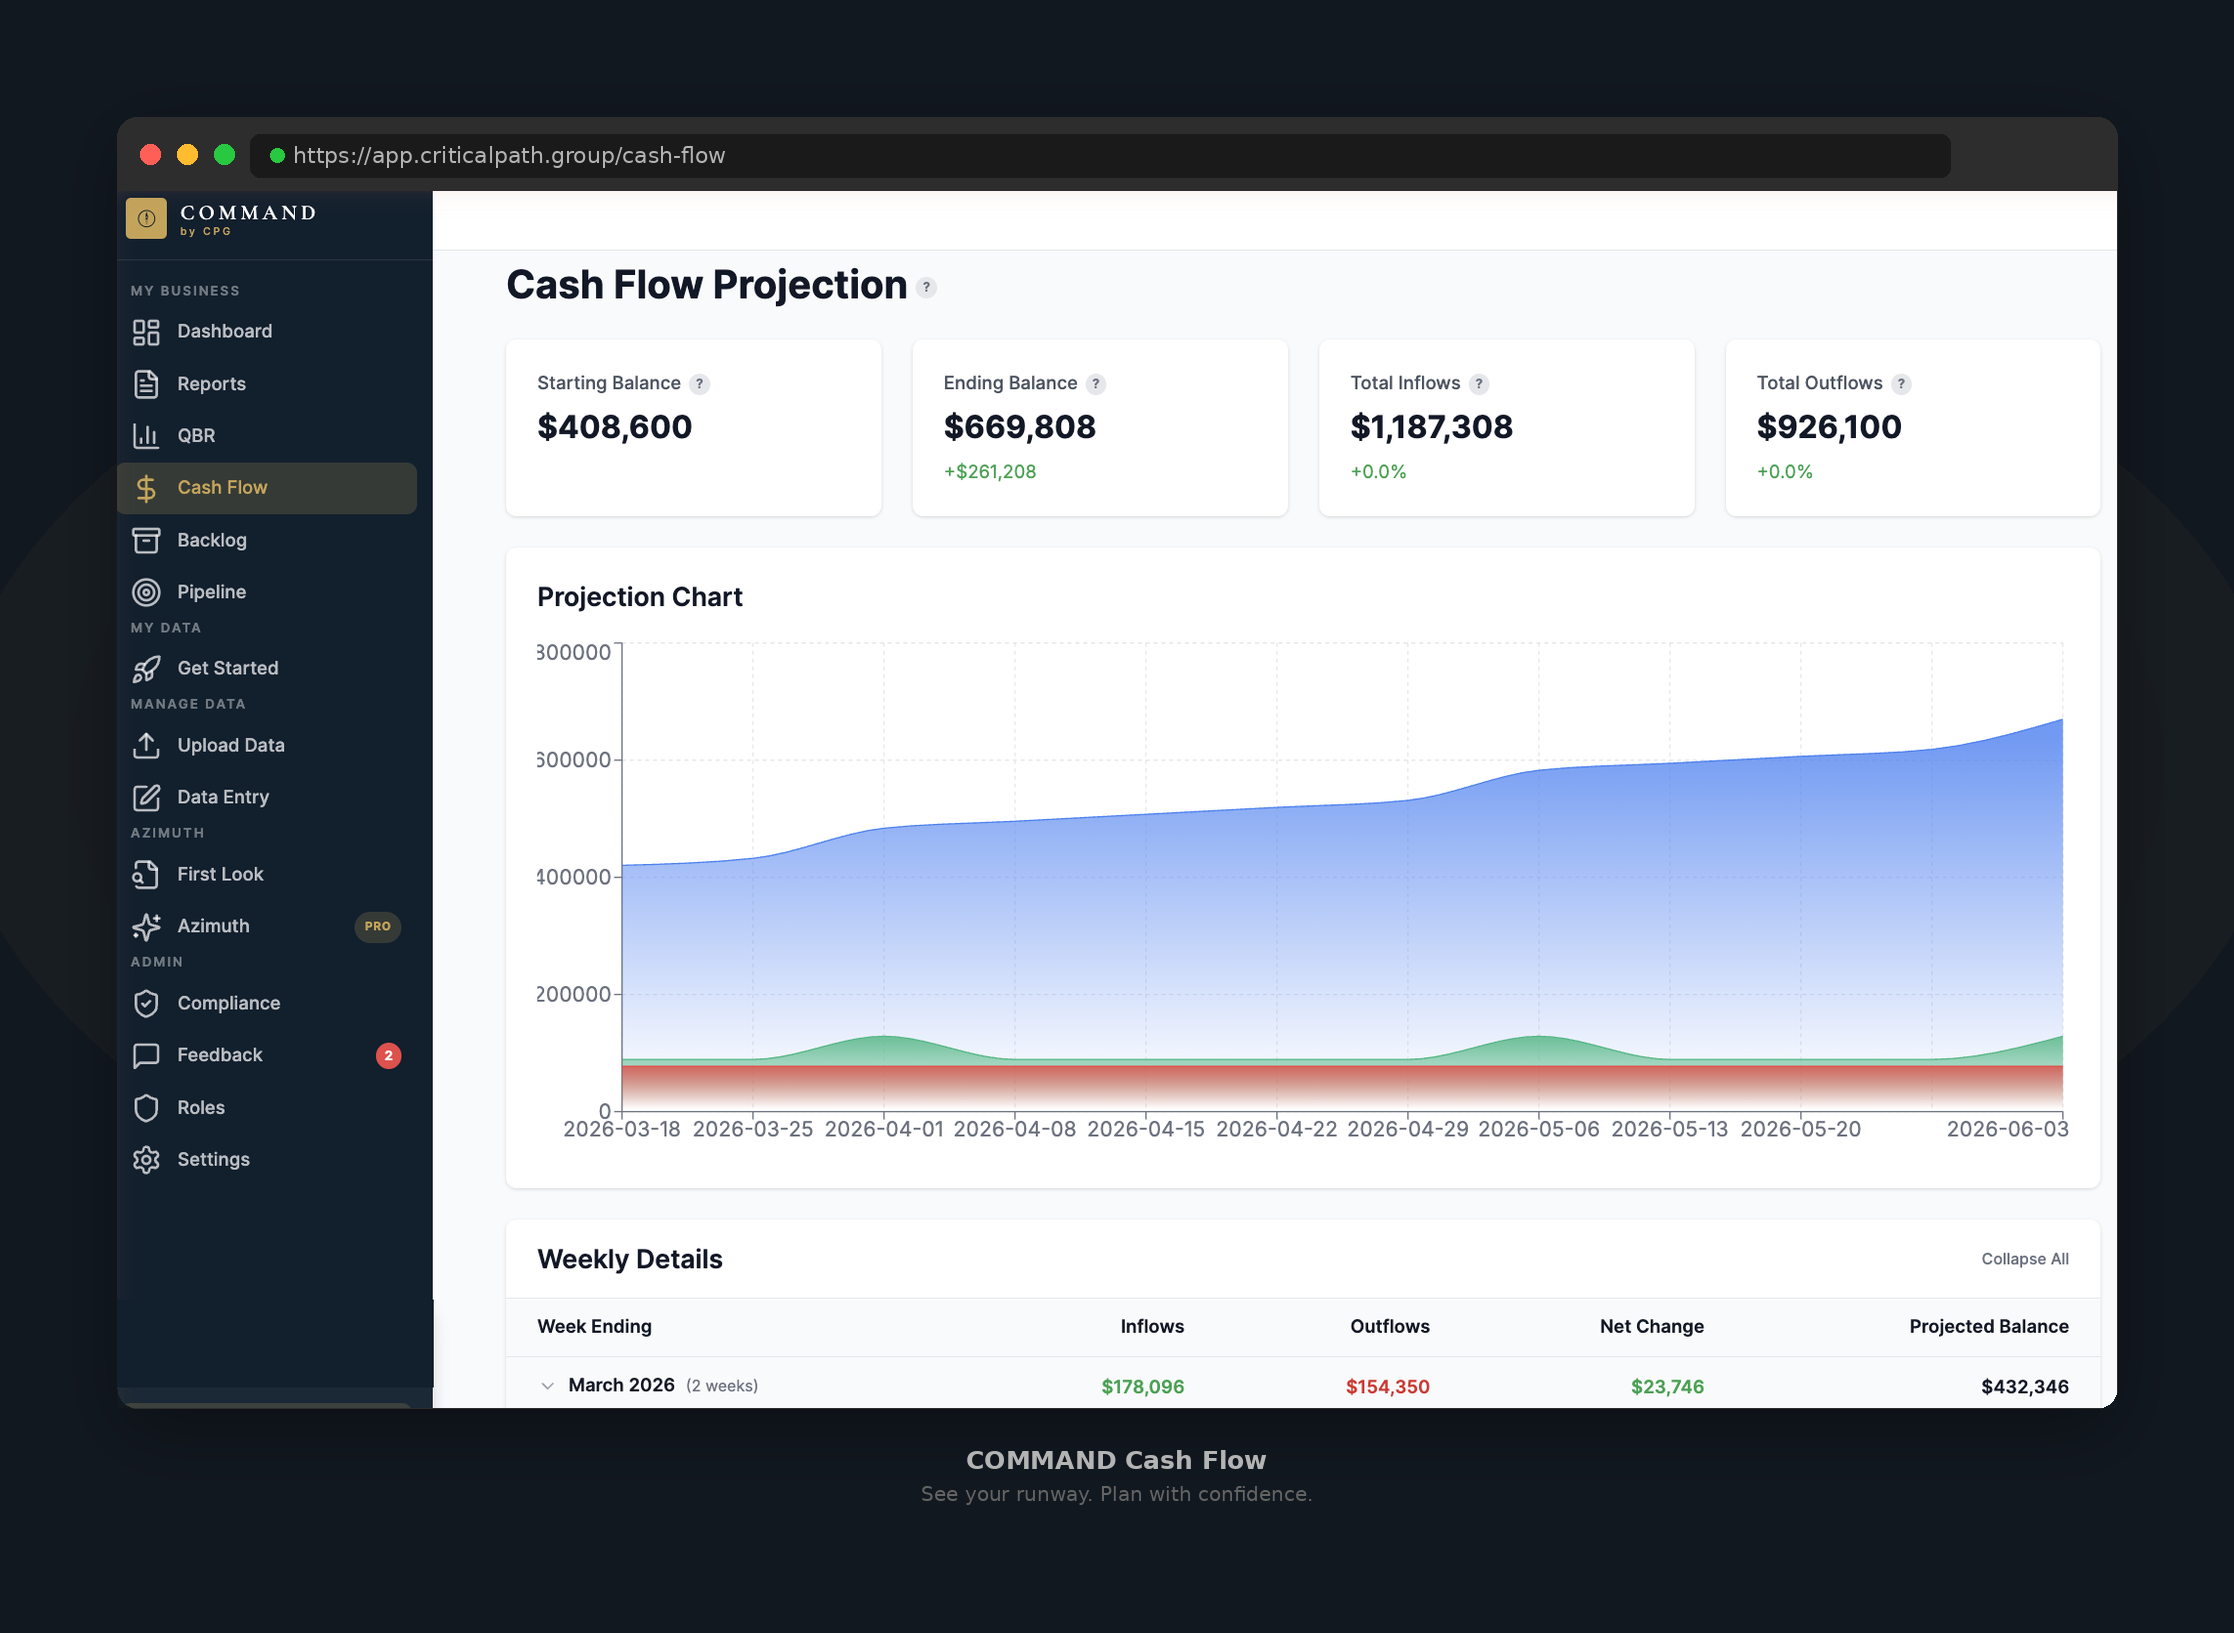
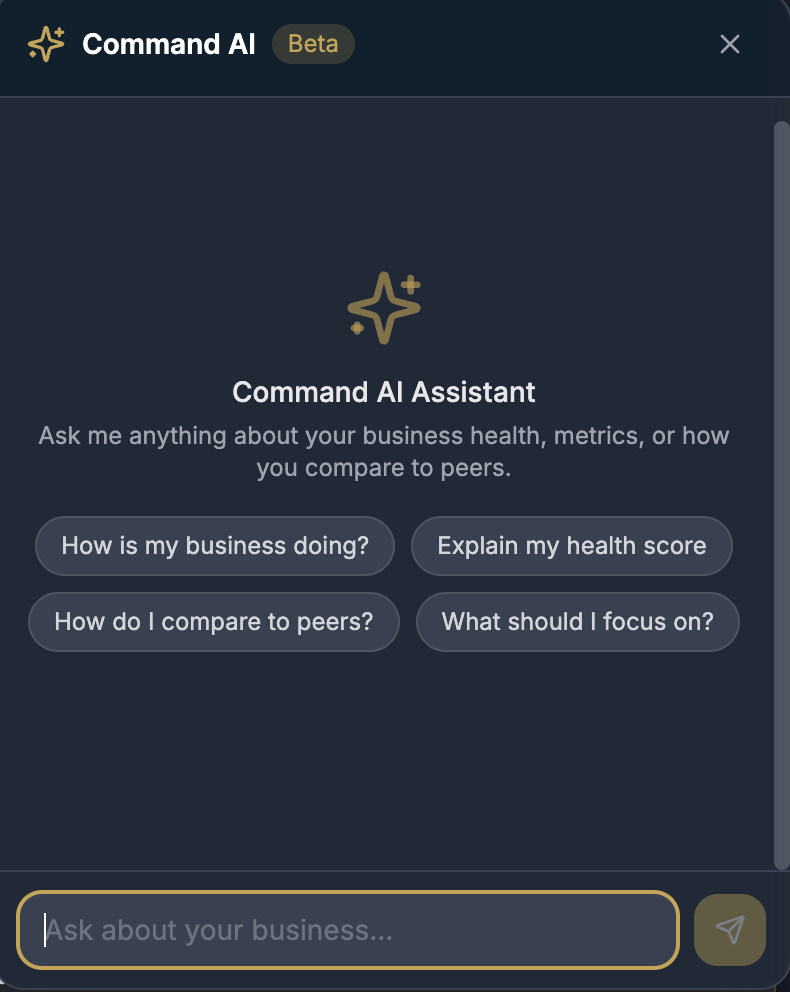
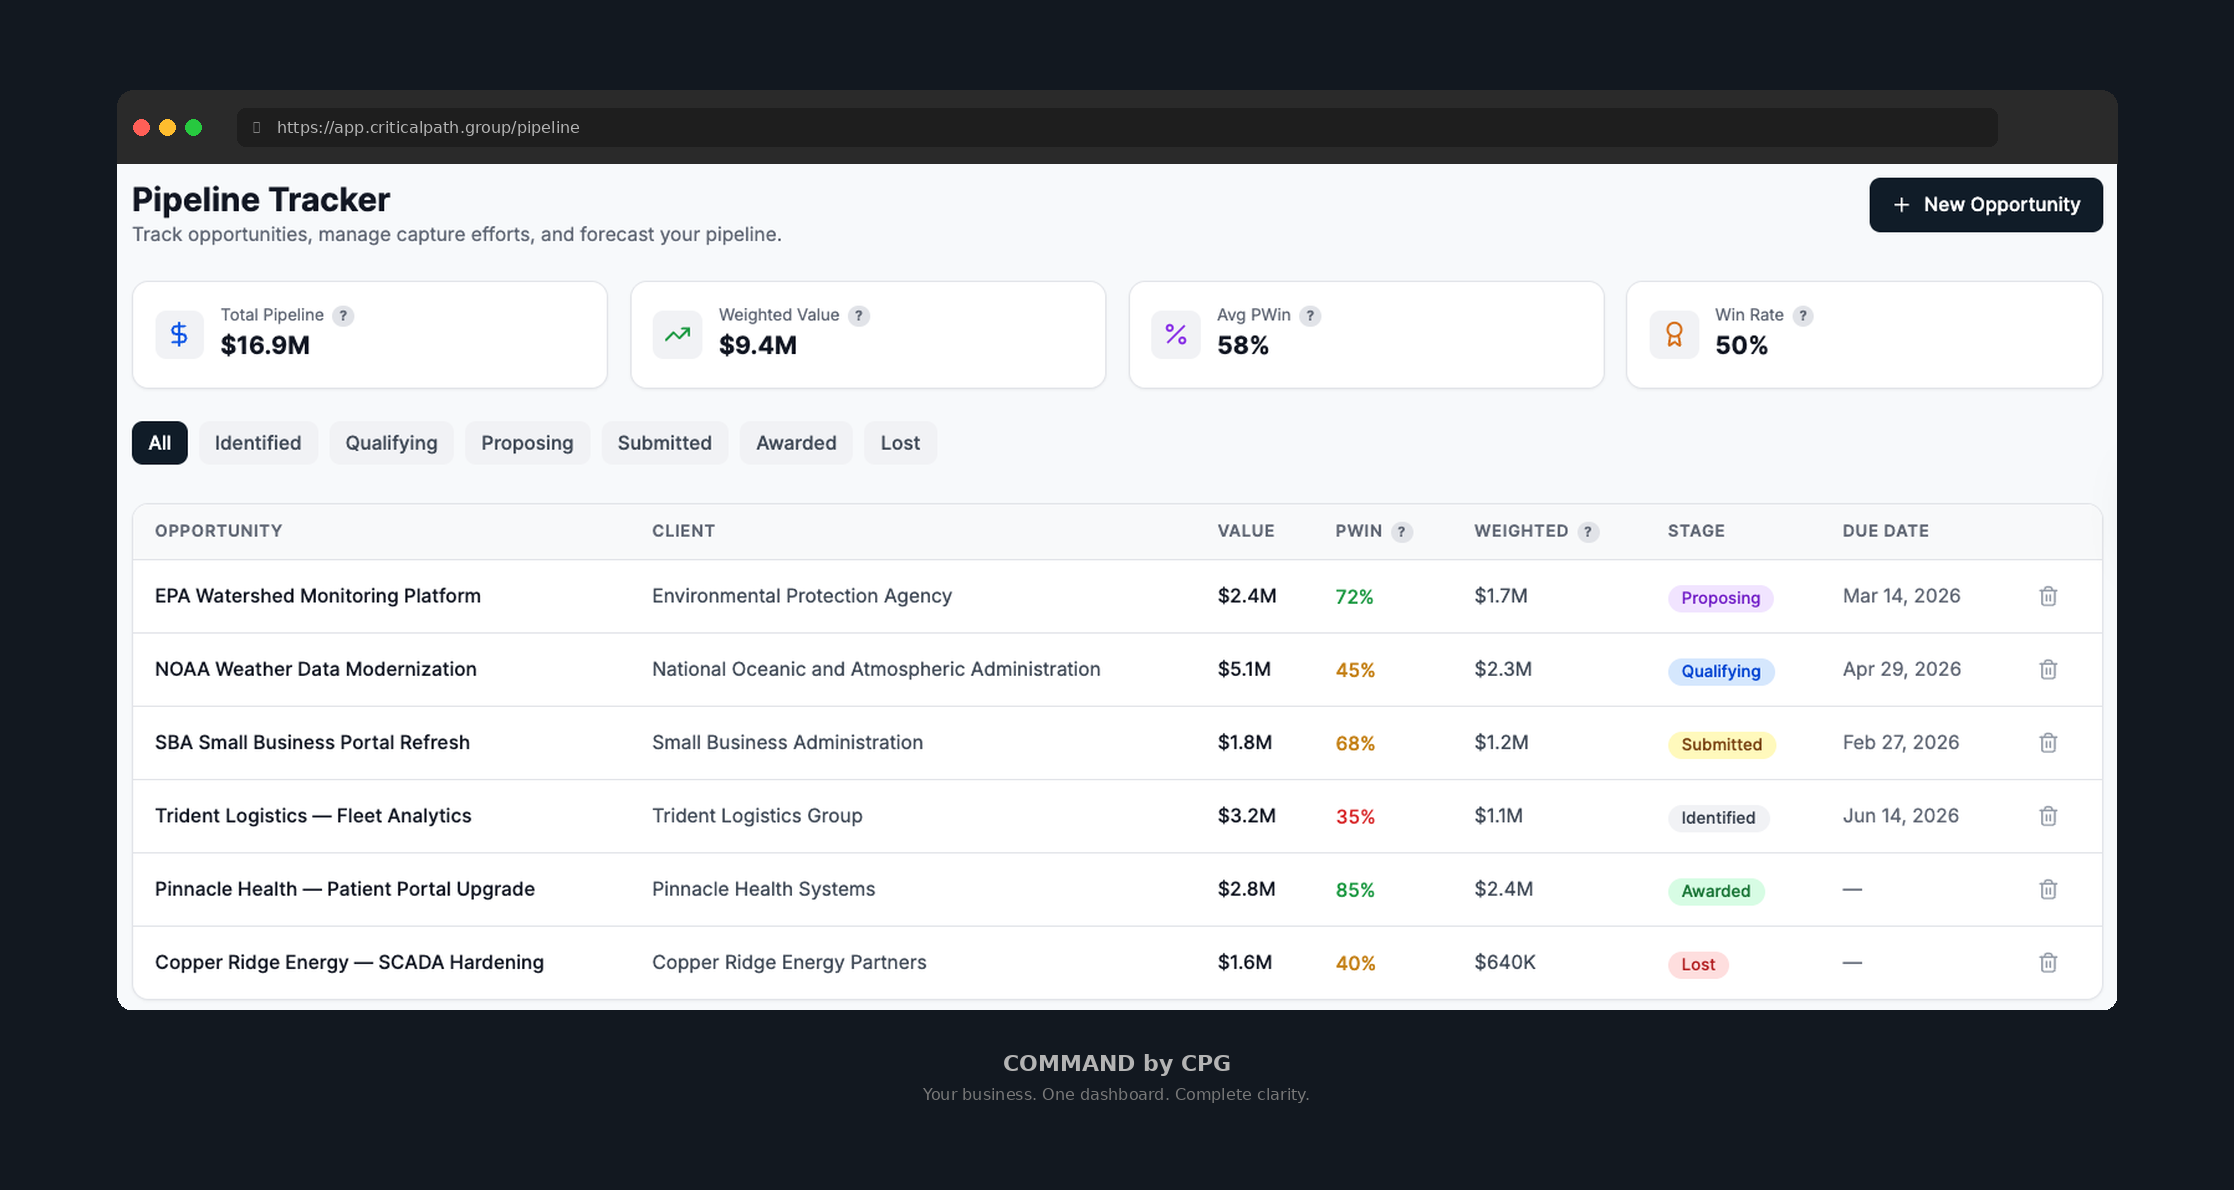
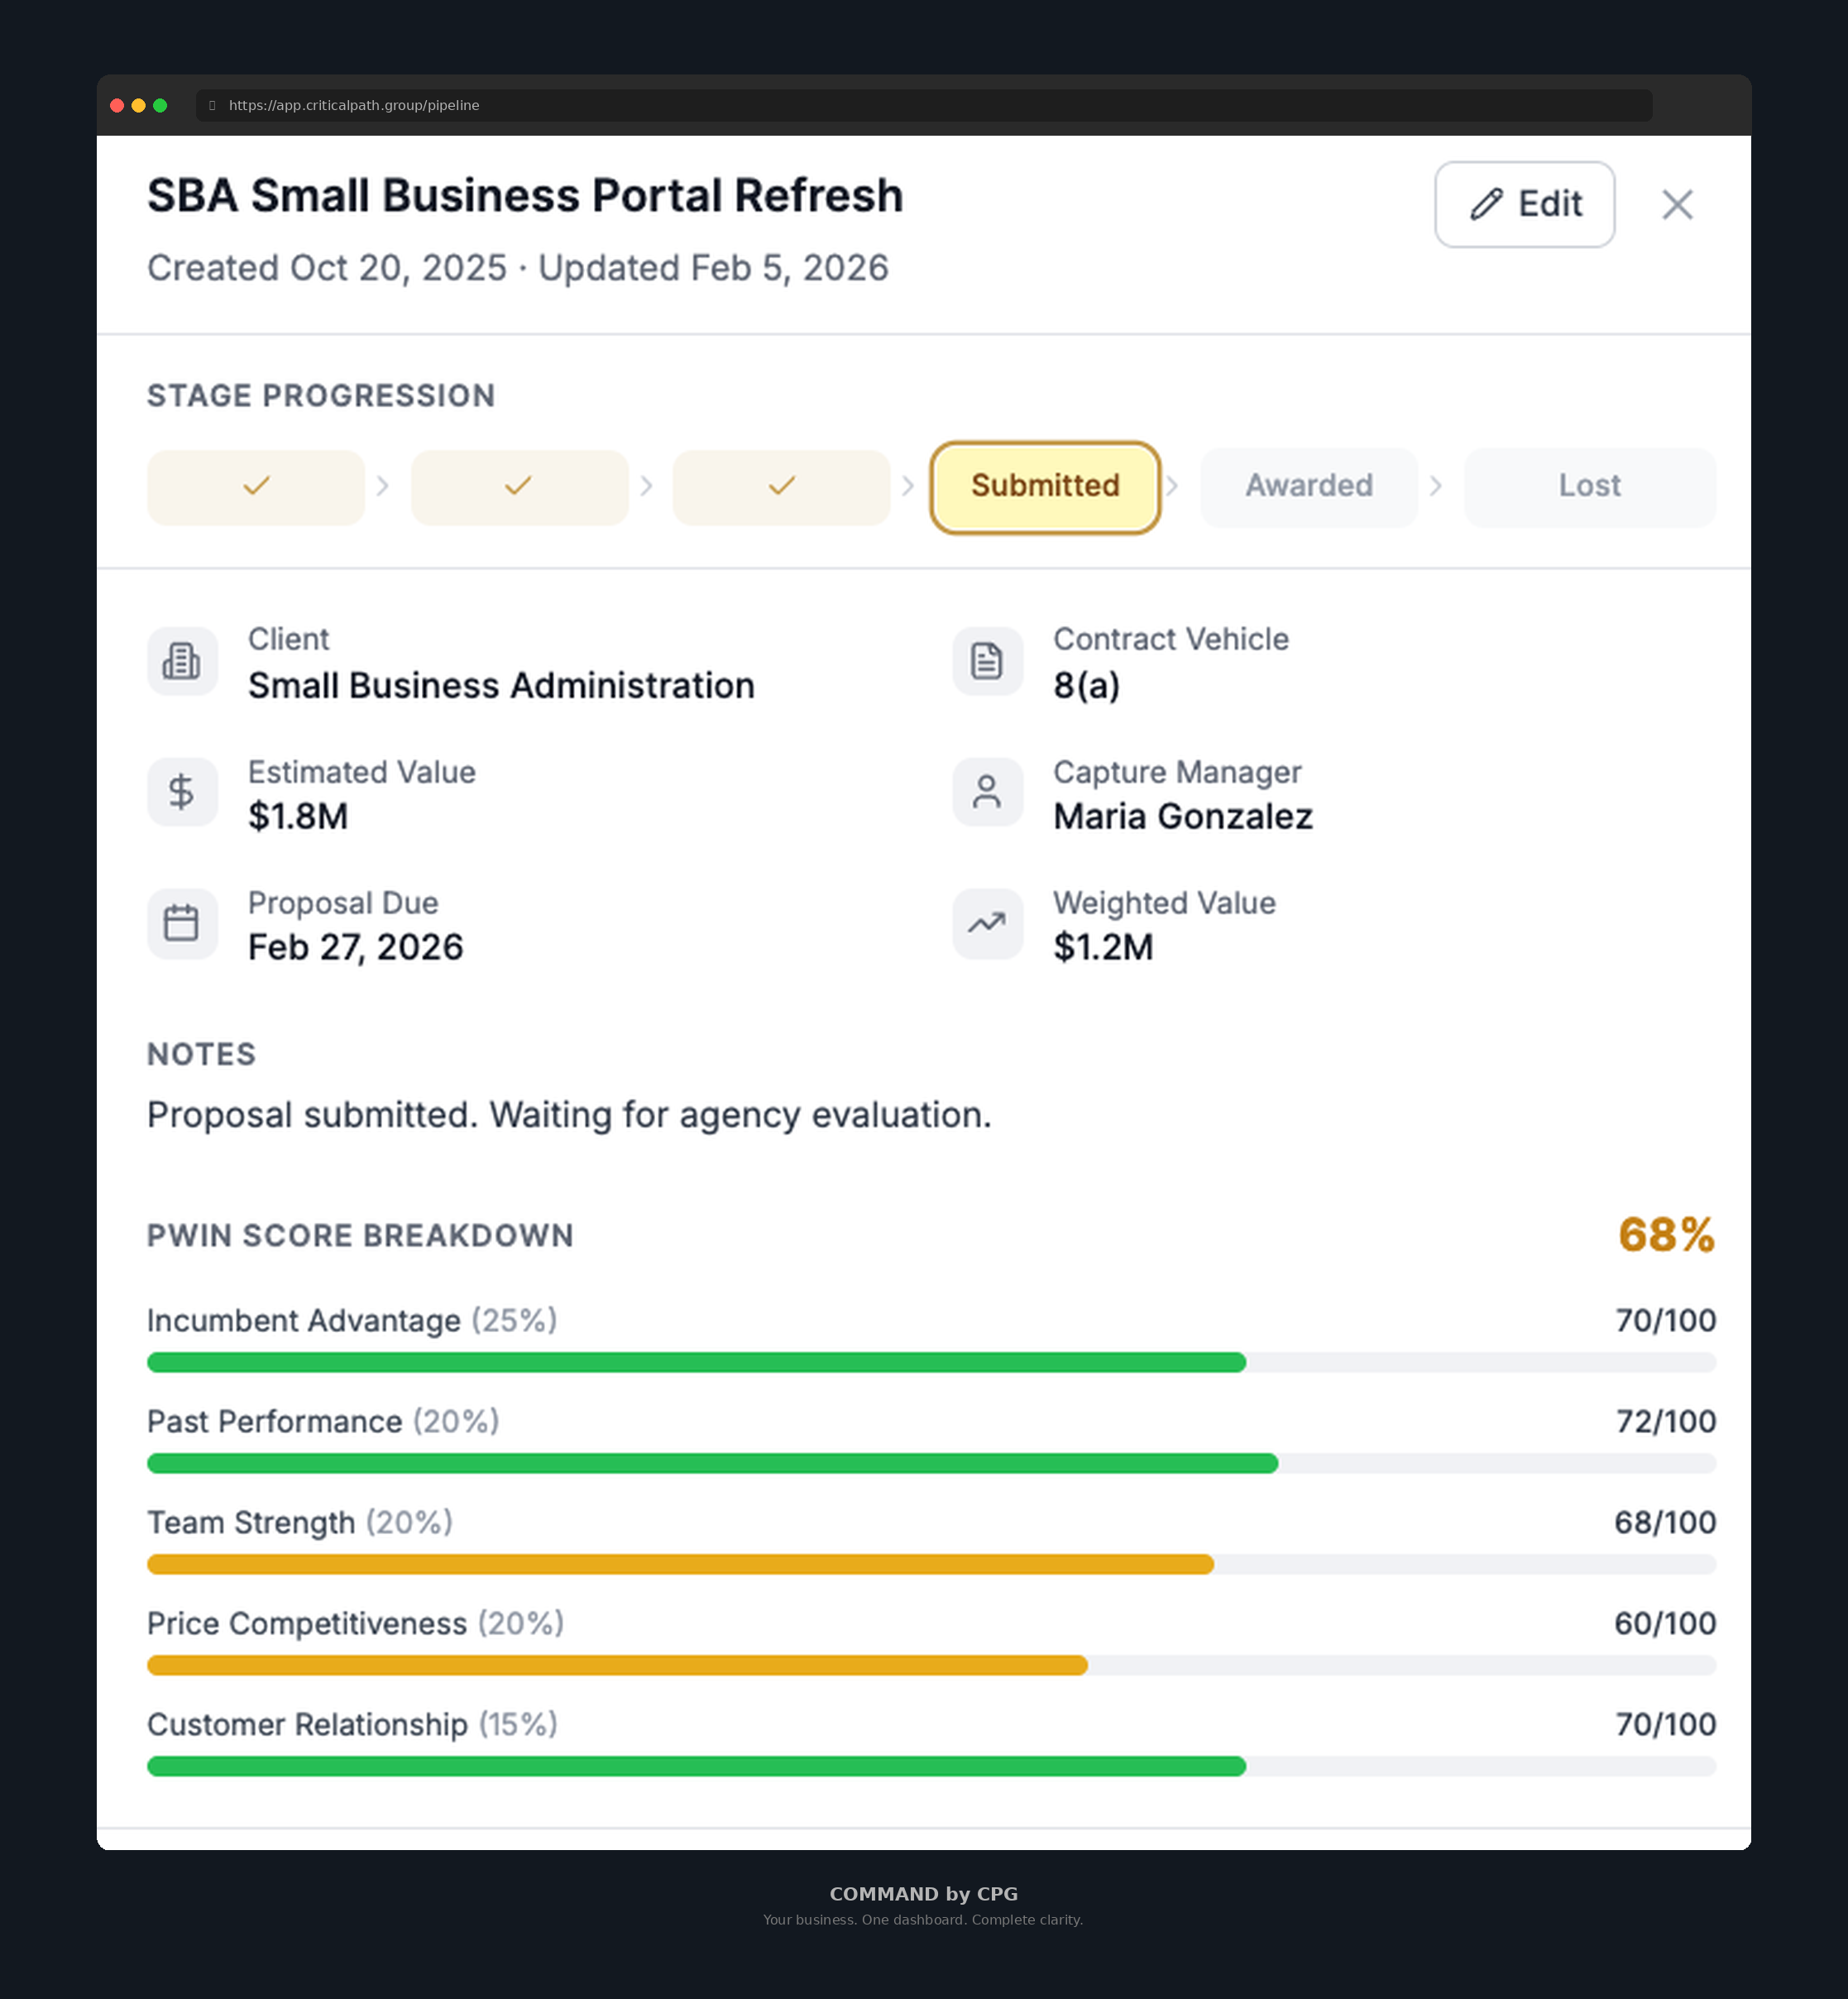
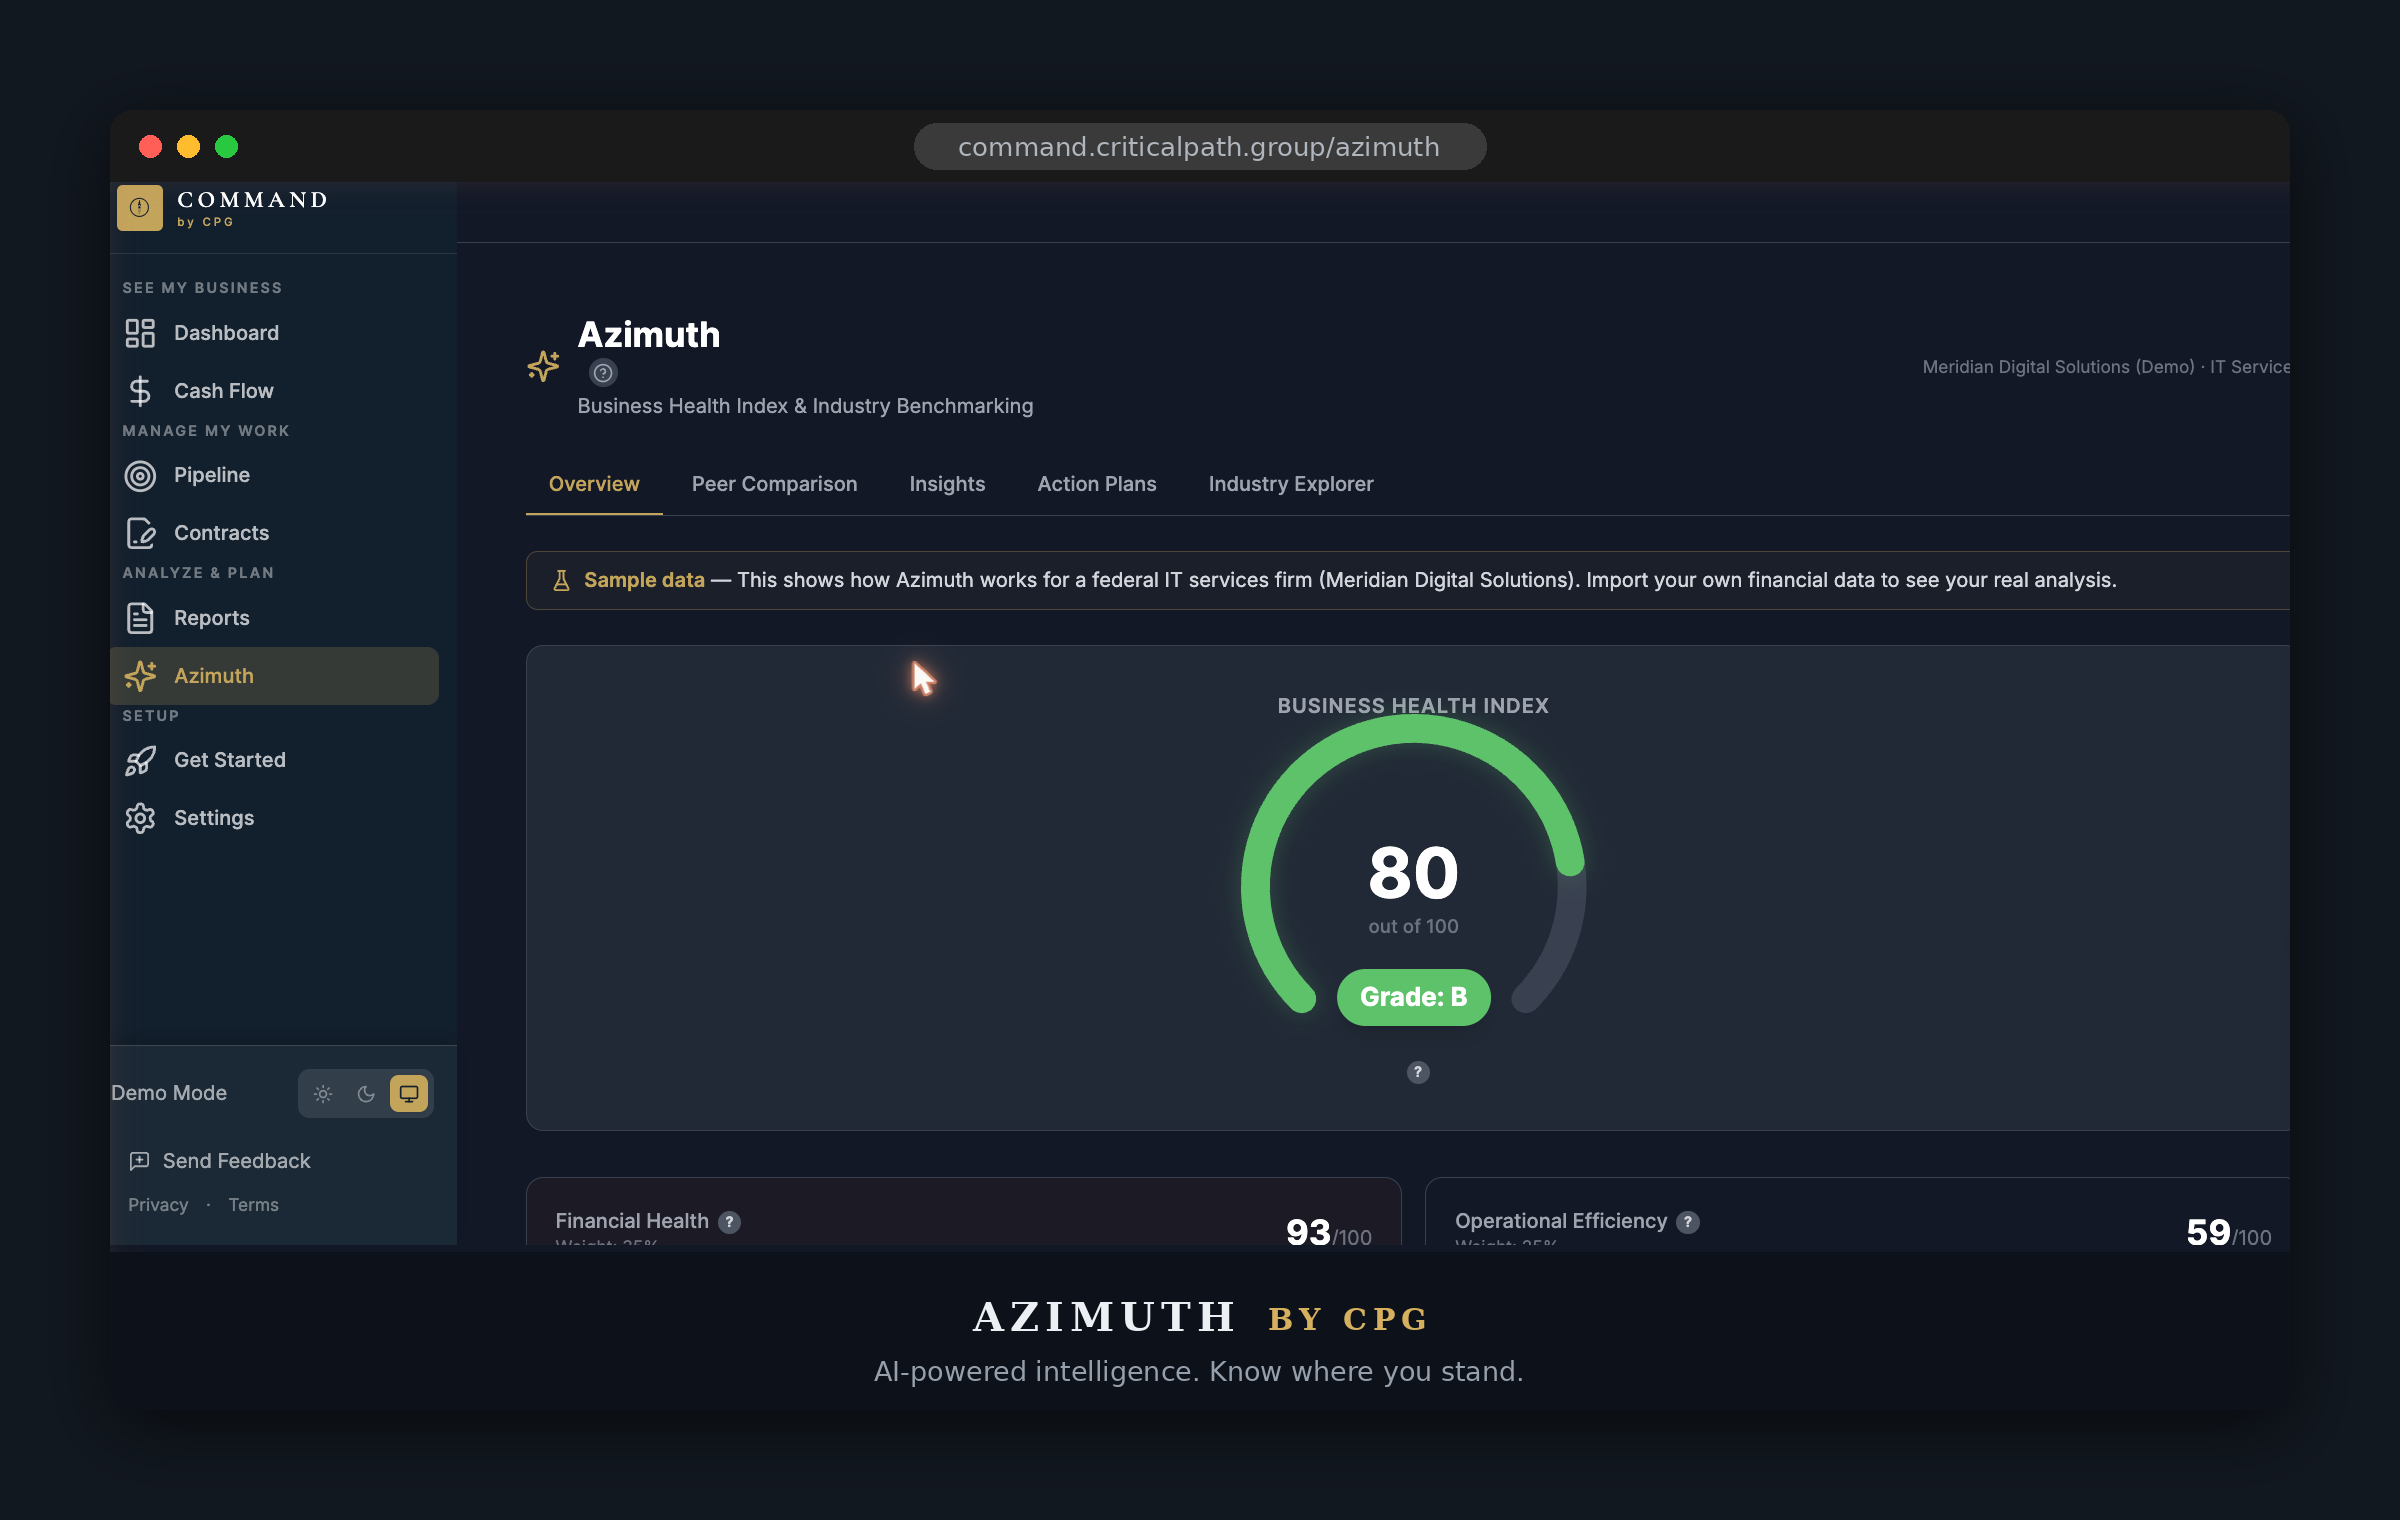
Our patent-pending Azimuth intelligence connects to QuickBooks or Xero, scores you across four signals (profitability, cash discipline, customer concentration, cost efficiency), and runs your live data, cash forecast, executive briefings, threshold alerts, and pipeline tracking on the same screen. $50/month. Built for small businesses with two to fifty employees.

Command Dashboard — unified financial dashboard showing KPI cards, revenue metrics, and Business Health Index

Peer-aware intelligence, with everything you need to run your business included.

Most small business tools give you the dashboard. Command gives you the dashboard AND the answer to what to do about it. Briefings that read like a CFO wrote them. Cash scenarios you can toggle. An AI that answers questions about your business in plain English. Pipeline that earns its forecast. Built on patent-pending Azimuth peer-aware intelligence.

One-Click Executive Briefings

A briefing that reads like your CFO wrote it, ready before your 9 a.m. By the time the coffee is done, you have a plain-English walkthrough of what changed last week, why it matters, and what to do next. Boardroom-ready, every Monday.

  • Plain-English narrative, not just a table
  • Automated weekly cadence (or on-demand)
  • Anomalies, trends, and recommended actions flagged
  • Export to PDF or PPTX for the board pack
One-Click Executive Briefings — AI-generated weekly narrative
Cash Flow Scenarios — 13-week rolling forecast with scenario toggles

Cash Flow Scenarios

Mark your largest customer as lost. Bump payroll. Add a new contract. Watch your 13-week runway redraw on the same screen. The number you needed before the call, before the call.

  • 13-week rolling cash forecast, auto-updated from QuickBooks or Xero
  • One-click scenario toggles — customer slip, contract win, payroll change
  • Threshold alerts when runway compresses
  • Seasonal adjustment and variance tracking

AI Assistant — ask the dashboard a question

Type the question your spreadsheet cannot answer — "Am I going to make payroll?", "How do I compare to peers my size?", "What should I focus on this week?" — and get a clear answer pulled from your live data, not a generic chatbot reply.

  • Natural-language questions about cash, margin, runway, and peer comparison
  • Answers grounded in your QuickBooks or Xero data, not the open web
  • Plain-English explanations of your health score and what is driving it
  • Available in every screen — ask while you are looking at the data
Command AI Assistant — chat interface with suggested prompts for business health, peer comparison, and weekly focus
Pipeline Tracker — KPI cards and opportunity table Pipeline Opportunity Detail — PWin score breakdown

Pipeline Tracker

Every opportunity from discovery to close, with a probability score that earns its weight. Forecast revenue you can actually defend in a board meeting, not a hopeful pipeline that always slips 30%.

  • Multi-stage pipeline visualization with stage age and slip risk
  • Probability-weighted revenue forecast by stage
  • Activity and engagement tracking per opportunity
  • Feeds the cash scenario engine — pipeline shifts redraw runway

Unified Executive Dashboard

Your entire business on one screen. Real-time metrics, KPIs, and alerts in one place, so you stop jumping between QuickBooks, spreadsheets, and inbox folders to assemble the same picture every Monday.

  • Real-time financial metrics and KPIs
  • Customizable layout by role
  • At-a-glance business health
  • One-click drill-down to source data
Unified Executive Dashboard
Business Health Index — BHI gauge and four pillar scores

Financial Health Index

A single number, 0 to 100, that tells you if your business is on solid ground. Combines profitability, liquidity, efficiency, and growth into one health score you can track month over month.

  • Profitability, liquidity, efficiency, and growth pillar scores
  • Trend analysis month over month
  • Peer-relative context, not just your own history
  • Drill into any pillar to see what is driving the score

CPOS Template Integration

Built on the Critical Path Operating System (CPOS). Integrates with CPOS templates for standardized reporting and a coherent operating rhythm across your team.

  • CPOS-aligned reporting structure
  • Standardized template library
  • Template customization for your team
  • Cross-portfolio consistency for multi-entity owners
CPOS Methodology — Assess, Decide, Plan, Execute, Review cycle

Up and running in under 15 minutes.

1

Connect Your Data

Link your accounting software, banking, or spreadsheets. We support QuickBooks, Xero, Stripe, and more.

2

Customize Your Dashboard

Choose your KPIs, set your alerts, and organize your workspace exactly how you need it.

3

Get Your First Briefing

Command generates your first executive briefing automatically. Start making data-driven decisions immediately.

Azimuth is the patent-pending intelligence inside Command.

Think about the products you trust most. The vehicle that drives itself has a named technology inside doing the driving. The phone that runs fast has a named chip inside doing the work. The financial data terminal that makes sense of the market has a named intelligence layer inside turning data into a point of view.

Each one is one product to the customer. Inside, a sub-brand does the hardest part.

Critical Path Group makes Command. Azimuth is the patent-pending intelligence inside Command that scores your business across four signals, compares you to a live peer pool of small businesses your size, and tells you what the numbers actually mean.

Same pattern. New problem.

Azimuth Intelligence inside Command — peer comparison and health score analysis powered by patent-pending Azimuth intelligence

See Command in action.

A 5-minute walkthrough — from the dashboard that scores you against your peers, to the cash question that wakes operators up at 4 a.m.

Open the walkthrough page →

Still running your business out of spreadsheets?

Command is built specifically to replace the manual financial-dashboard spreadsheet most small business owners maintain, with live data, peer benchmarking, scenario modeling, alerts, and one-click exports.

Command vs. Spreadsheets: See the Comparison →

See it with your own data.

Try Command free for 14 days. No credit card required. $50/month after trial — everything included. Cancel anytime.

Start your 14-day free trial View Pricing